Learning Outcomes
On completion of this lesson you will be able to specify the coordinates of a quadrilateral and use techniques related to coordinate geometry to draw the actual shape
Go to top Download Program Code
On completion of this lesson you will be able to specify the coordinates of a quadrilateral and use techniques related to coordinate geometry to draw the actual shape
Go to topThis lesson follows directly on from the previous lesson. That lesson was devoted to drawing individual lines while the current one concentrates on drawing a closed quadrilateral shape by drawing the individual lines that make up that shape.
For a change we shall not be examining the entire code of the application. This is because most of the function are identical to their equivalent in the previous lesson. We shall instead concentrate on newly added functions as well as existing functions that we have modified.
Go to top
def main():
arrPage = []
strFileName="Quadrilateral"
intMaxCols=800
intMaxRows=800
arrPage = createBackground(intMaxCols,intMaxRows)
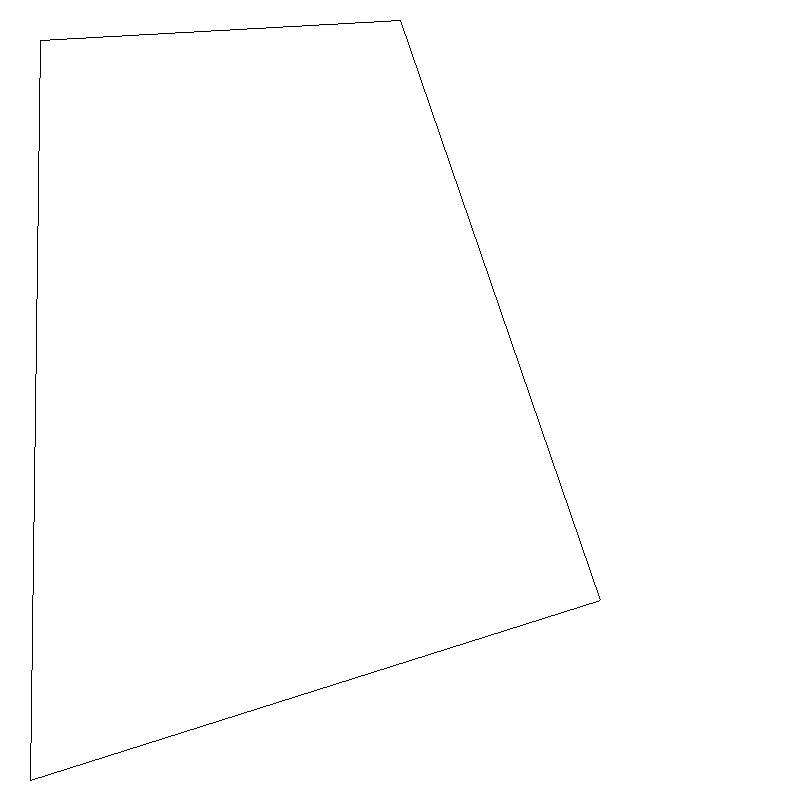
arrPage = drawShape(arrPage,[[400,20],[40,40],[30,780],[600,600],[400,20]])
saveFile(arrPage,intMaxRows, intMaxCols,strFileName)
if __name__ == "__main__":
main()
print("Programme finished")
This version of the function main() is much shorter than its predecessor. This is because at line 76 the coordinates for our shape are passed to the function drawShape() as a two dimensional list. In the previous version eight different lines were used, one for each line we wished to draw.
On returnig from this function call line 78 saves the data to a file.
Go to top
                        def drawLine(arr, x1, y1, x2, y2):
                            if x1 != x2:
                                m = (y1 - y2)/(x1 - x2 )
                            if y1 == y2:
                                startX = min(x1, x2)
                                endX = max(x1, x2)
                                for x in range(startX,endX):
                                    arr[y1][x]=1
                            elif x1 == x2:
                                startY = min(y1, y2)
                                endY = max(y1, y2)
                                for y in range(startY, endY):
                                    arr[y][x1]=1
                            elif m <= 1 and m >= -1:
                                if x1 < x2:
                                    for x in range(x1, x2):
                                        y = round(m*(x - x2) + y2)
                                        if y < 800:
                                            arr[y][x]=1
                                else:
                                    for x in range(x2, x1):
                                        y = round(m*(x - x2) + y2)
                                        if y < 800:
                                            arr[y][x]=1
                            else:
                                if y1 < y2:
                                    for y in range(y1, y2):
                                        x = round((y - y2)/m + x2)
                                        arr[y][x]=1
                                else:
                                    for y in range(y2, y1):
                                        x = round((y - y2)/m + x2)
                                        arr[y][x]=1
                            return arr
The function drawLine() is esentially the same as its predecessor except that we have done a some tidying up.
At lines 13 and 14 the gradient of the line is calculated provided it is not a vertical line. (The gradient of a vertical line is an undefined number.
Lines 15 to 19 control the drawing of a horizontal line, while lines 21 to 24 control the drawing of a vertical line.
Lines 25 to 44 control the drawing of all lines apart from the vertical and the horizontal. Of those range, lines 25 to 35 control the lines whose gradients lie between -1 and 1 (excluding horizontal lines) while lines 37 to 44 cater for lines whose gradients are greater than 1 or less than -1.
Go to top
                        def drawShape(arr, shape):
                            for intCoords in range(len(shape)-1):
                                startX = shape[intCoords][0]
                                startY = shape[intCoords][1]
                                endX = shape[intCoords+1][0]
                                endY = shape[intCoords+1][1]
                                arr=drawLine(arr,startX, startY, endX, endY)
                            return arr
Like its predecessor the function drawLine() can only process a single line using its x and y coordinates. To overcome this we have the intermediary function drawShape(). Its arguemt shape is passed to it from line 76 of the function main().
It is controlled by a for loop that spans lines 48 to 53. It reads the start and end coordinates of each line, and then passes those to drawLine() for actually drawing the line.
When all of the lines are drawn, line 54 passes control back to line 78 of main. Here the saveFile() is called to save the data.
The outut is shown below.
This lesson has shown how to draw a quadrilateral by drawing the individual lines that make up that shape. The function drawShape() was introduced to overcome the limitation of the function drawLine() which can only draw a single line at a time.
It is important to note that the function drawShape() can be used to draw any shape that can be defined by a series of lines. The only requirement is that the coordinates of the shape are passed to it as a two dimensional list.
Go to topWrite a Python program that draws a hexagon. The coordinates of the hexagon are as follows:
Save the output to a file named "Hexagon".
Go to top