Learning Outcomes
On completion of this lesson you will know how to utilise the skills you lernt in coordinate geometry and in studying lists and arrays to draw lines.
Go to top Download Program Code
On completion of this lesson you will know how to utilise the skills you lernt in coordinate geometry and in studying lists and arrays to draw lines.
Go to topIn this lesson we will be implementing what we learnt in the previous lessons regarding drawing lines using the concepts of coordinate geometry. In those lessons we did not actually draw any shapes or lines. Instead we used the coordinates of the lines as guides to colouring in squares in a grid.
Here we shall use the concepts that we have learnt to draw lines. Instead of being on paper those lines will be elements in lists which we will colour black to mark the pixels of the lines we draw.
The line numbers in the code blocks below in this page may look strange. The reason for this is that the function main() must be the last item in the program. However since it controls all of the other functions we decided to list it first as it provides an overview of the entire application, and therefore we shall not be discussing the other functions in isolation.
Once we have finished with function main() however, all of the other functions appear as they are in the actual code and the line numbering corresponds to that of the actual code.
Go to top
def main():
arrPage = []
strFileName = "DrawLines5"
intMaxCols = 800
intMaxRows = 800
arrPage = createBackground(intMaxCols,intMaxRows)
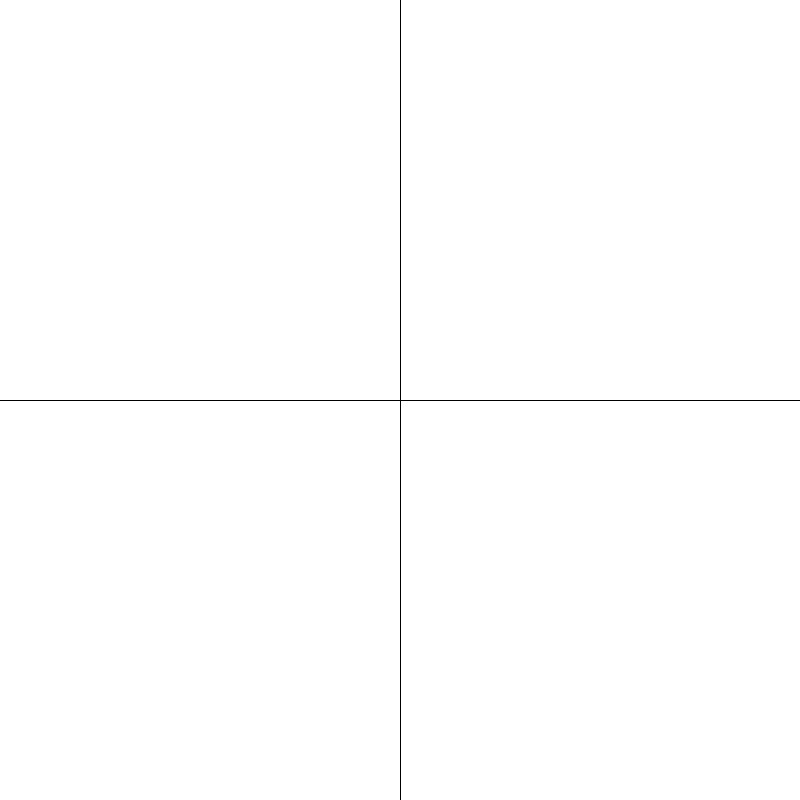
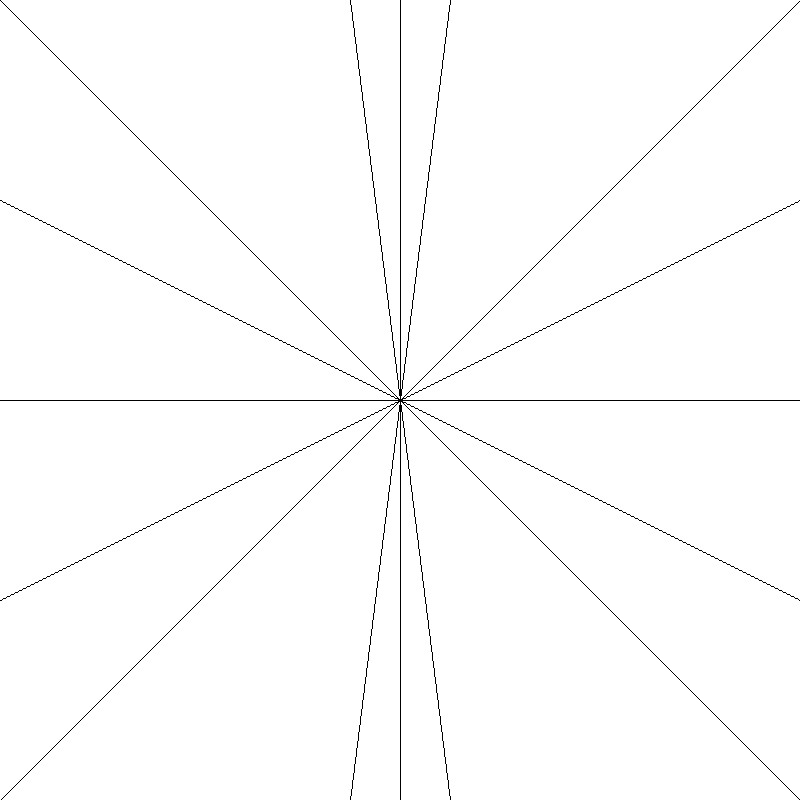
arrPage = drawLine(arrPage,0,400,800,400)
arrPage = drawLine(arrPage,400,0,400,800)
arrPage = drawLine(arrPage,0,0,800,800)
arrPage = drawLine(arrPage,0,800,800,0)
arrPage = drawLine(arrPage,0,200,800,600)
arrPage = drawLine(arrPage,0,600,800,200)
arrPage = drawLine(arrPage,350,0,450,800)
arrPage = drawLine(arrPage,450,0,350,800)
saveFile(arrPage,intMaxRows, intMaxCols,strFileName)
if __name__ == "__main__":
main()
print("Programme finished")
This is our main function and like most of its kind it acts as the switchboard for the entire application.
At line 47 it sets up an array named arrPage. Currently it is empty but soon we shall fill it with data that will comprise the lines that we shall be drawing.
Line 48 it initialises a variable strFileName which will contain the name of the file where we shall store our image data.
At lines 49 and 50 the variables intMaxCols and intMaxRows control the number of elements in each sublist and the number of sublists in the main array.
At line 51 we meet our first instance of processing. The function createBackground() is called with the values of intMaxCols and intMaxRows passed to it as arguments. As its name implies it will provide the background against which we shall be drawing our lines. How this function operates is explained below.
Once a background is provided, at line 51 we use the function drawLine() at lines 52 to 59 for drawing lines in our two dimensional array.
Finally at line 61 we call the function saveFile() to save the contents of our list to a file.
Go to top
                        def createBackground(maxWidth,maxHeight):
                            #initialises image to white
                            arrAll=[]
                            arrRow=[]
                            for intRows in range(maxWidth):
                                for intCols in range(maxHeight):
                                    arrRow.append(0)
                                arrAll.append(arrRow)
                                arrRow=[]
                            return arrAll
Here is where we set up a blank canvas that later we can draw lines and shapes on. We start off by initialising two lists arrAll and arrRow at lines 3 and 4. The processing is contained in lines 5 to 9 which consist of nested for loops.
The first loop at line 5 iterates 800 times. On each single iteration of this loop the nested loop, which consist of lines 6 and 7 iterates 800 times on its own.
Each iteration of this inner loop builds up a list containing instances of the value zero. At each iteration a zero is added to the list arrRow at line 7. Once the iteration is complete the list is appended to the main list, arrAll at line 8.
At line 9 arrRow is initialised to blank, so that on the next iteration of the loop starting at line 5, it can build up its load of 800 zeros again.
Once the outside loop has completed its iterations we have a list containing 800 sublists, each sublist containing 800 elements of value zero.
This video gives an idea of how the nested list is built up, except that it uses a 4 X 4 pixel example instead of the actual 800. On the previous page, Introduction, Fig 3 gives a visual representation of it: again with size reduced to 16 X 16.
Go to topThe function drawLines() below can draw straight lines at any angle we choose. We shall discuss each individual part of it regarding the different type of lines it draws.
                        def drawLine(arr, x1, y1, x2, y2):
                            if x1 != x2:
                                m = (y1 - y2)/(x1 - x2)
                            if y1 == y2:
                                for x in range(x1,x2):
                                    arr[y1][x]=1
                            elif x1 == x2:
                                for y in range(y1, y2):
                                    arr[y][x1]=1
                            elif m <= 1 and m>= -1:
                                for x in range(x1, x2):
                                    y = round(m*(x - x2) + y2)
                                    if y <800:
                                        arr[y][x]=1
                            else:
                                for y in range(y1, y2):
                                    x = round((y - y2)/m + x2)
                                    arr[y][x]=1
                            return arr
When this fucntion is called from line 52 of Listing 1 it is passed the arguments arrPage, 0, 400, 800, 400. The argument arrPage maps to arr at line 12. This is simply the two dimensional array discussed in the previous section.
The other four arguments are mapped onto x1, y1, x2 and y2. Thus we have
x1 = 0
y1 = 400
x2 = 800
y2 = 400
Since both y1 and y2 have a value of 400, we shall be drawing a horizontal line. With that knowledge let us look at how the function drawLine() works.
At line 13 x1 is not equal to x2 since zero and 800 are not equal. Therefore m will be calculated as (400 - 400)/(0 - 800). This will give a value of zero. The variable m is not, however, used in this case
At line 15 the values of y1 and y2 are compared. In this case they are equal since both have a value of 400. For this reason the block at lines 16 and 17 is executed
In the for loop at line 16 x iterates from zero to 799. For each iteration a value of 1 is put into the element that corresponds to the values of x and y1. Some of the coordinates here will be (0, 400), (1, 400), (2, 400)...(797, 400), (798, 400), (799, 400).
All of the y values being the same, again indicates a horizontal line.

When the function drawLine() is called from line 53 of Listing 1, apart from the argument arrPage the coordinate values are 400, 0, 400 and 800. They will be mapped onto x1, y1, x2 and y2 as follows
x1 = 400
y1 = 0
x2 = 400
y2 = 800
At line 13 the condition is false since both arguemts have the same values, i.e. 400. The body therefore is skipped and control passes to line 15.
Here at line 15 the condition is again false since y1 is zero and y2 is 800. The body of this condition is also skipped and control passes to line 18.
Here the condition is true since both x1 and x2 have a value of 400.
In the loop starting at line 19, y iterates from 0 to 800. At line 20, on each iteration 1 is put in each cell whose coordinates match the value of y and x1. Some of the coordinates will be (400, 0), (400, 1), (400, 2)...(400, 797), (400, 798), (400, 799).
The fact that the value of x does not change means that we are dealing with a vertical line.
In Listing 1 lines 54 to 59 pass arguments to drawLine() that produce lines which are neither horizontal or vertical. The gradients of those lines fall into two groups:
For the former the coordinates of the line are calculated as y = m*(x-x1) + y1
For the latter the coordinates are calculated as x = (y-y1)/m + x1
In Listing 3 these are processed by the section spanning lines 21 to 29. Lines 22 to 25 process the lines whose gradients lie between -1 and +1, while lines 27 to 29 process the lines whose gradients are greater than 1 or less than -1.
                        def saveFile(arrAll, maxRows, maxCols,fileName):
                            myfile=open(fileName+".pbm",'w')
                            myfile.write('P1' +"\n")
                            myfile.write(str(maxRows)+" "+str(maxCols)+"\n")
                            for intRows in range(maxRows):
                                myfile.write(getArray(arrAll[intRows])+"\n")
                            myfile.close()
This function is called from line 61 of main(). Its purpose is to save the two dimensional list that we have processed, to a file for storage. For this purpose the function is passed the following data:
At line 33 the extension ".pbm" is added to the file name and the file is opened in write mode.
The first item to be written to the file is "P1" to indicate that it is a PBM file. This is done at line 34
At line 35 the values of maxRows and maxCols are converted to string and then written to the file, separated by a space character. This is to inform any software reading the file contents what dimensions to assign for the width and breadth of the image.
Lines 36 and 37 control the writing of the data to the file. The loop counter intRows iterates from zero to 799. At each iteration it will pass a sublist from the main list to the function getArray(). This function converts the sublist passed to it to string format and then returns the string. The returned string is then saved to the file.
Once all of the sublists have been converted and saved to the file, the file is closed at line 38.
Go to top
                        def getArray(passedValue):
                            strOutString=""
                            for intVal in passedValue:
                                strOutString=strOutString+str(intVal)
                            return strOutString
This function is only called from the function saveFile(). It only passes one argument passed to this function: passedValue. The argument passedValue is a list, which in this case contains 800 elements
At line 41 a blank string, strOutString is defined. This string will be used to store each element read from the list.
The for loop at line 42 iterates over each element in passedValue
At line 43 the appropriate element is read from the list. It is then converted to string and appended to strOutString.
On completion of the loop line 44 returns the string to the calling function.
Go to topIn this lesson we concentrated solely on drawing lines. In the next lesson we shall look at creating shapes composed of straight lines such as triangles, rectangles, parallelograms and irregular quadrilaterals.
Most of the code requirerd for those shapes has already been written for this lesson. We only need the extra functionality of being able to supply five pairs of coordinates to the system and telling the system draw lines between each pair of coordinates
Go to topIn this lesson we have learnt how to draw lines using the concepts of coordinate geometry. We have also seen how to save the data to a file for storage.
Go to topWrite a program that draws a triangle with vertices at (200, 200), (600, 200) and (400, 600). Save the image data to a file named DrawTriangle. The program should be able to draw the triangle in any orientation.
Modify the program to draw a rectangle with vertices at (200, 200), (600, 200), (600, 600) and (200, 600). Save the image data to a file named DrawRectangle.
Go to top