Reports are the one aspect of a Database system that are designed to end up as paper documents. Generally speaking, reports are summaries of data stored in tables. A report can be based on either a table or a query but most reports are based on queries since reports often display calculated fields. The main strengths of reports, however, are that they can group the data for us and also can provide totals and subtotals.
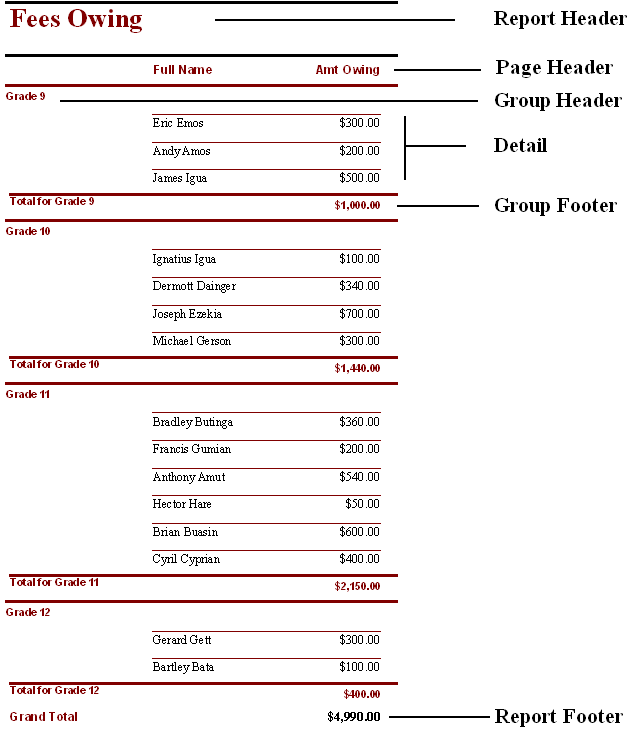
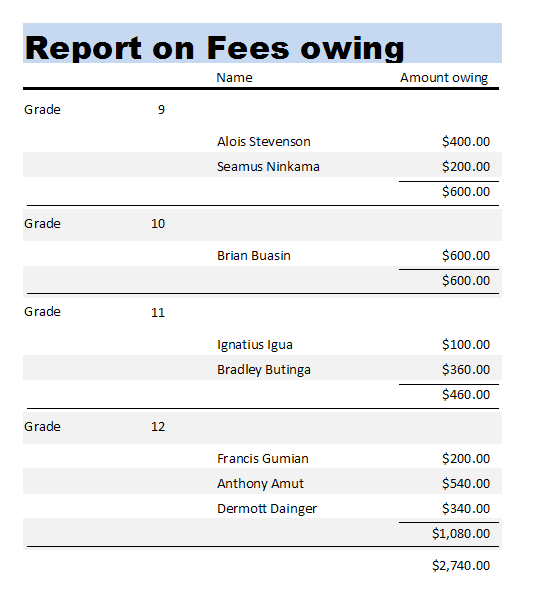
In Fig‑1 we have an example of a simple report on fees owing. Although reports may be many pages long this one is a single page report and so all sections of it are visible.
Reports are always grouped and always one group exists inside another. Each group may have a header and a footer. The header contains the name of the group while the footer contains a summary of the same group.
The main grouping is the report itself and it also has a header and a footer. The header contains the title of the report – “Fees Owing” in this case, while the footer contains the grand total, which in our case is the total amount owed by all of the students
The only other group in this report is the Grade group. Since the field grade can have any one of four values – 9, 10, 11 and 12 – this group is repeated four times, once for each value. Each repetition has its own header and footer. The header contains the name of the group while the footer contains the subtotal for that group.
Fig 1
Now that we know the components of a report let us look at how to create one similar to the one above. As with just about everything in Access there are two ways of creating a report – manually and using a wizard. And of course the wizard, like all other wizards, can do 90% of what you want to do, but you need to be able to create a report manually in order to be able to tweak the other 10% to your own requirements. Our sample report will be based on a query we looked at earlier for calculating the amount owed by those who had not paid their full fees. We shall first look at creating a report using a wizard.
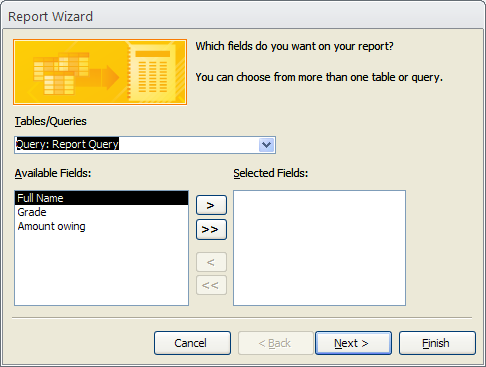
Starting off creating a report by using a wizard is the same as starting off any other object we have done so far. We go to the Create tab and in the Reports group click on Report Wizard. This brings up the first stage of the wizard as shown in Fig‑2 below.
Fig 2
A report, like a form, is based on either a table or a query and thus our first step is to assign one of them to the report. As we stated earlier we shall use the query we had above for printing out details of students who still owed fees. We select this query from the drop down list labeled Tables/Queries. Once we do this the fields of this query are displayed in the box Available Fields.
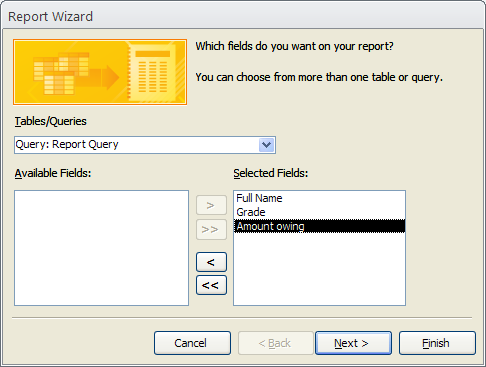
We only need the fields Full Name, Grade and Amt Owing and thus we move those three fields across to the Selected Fields box. To do this we click on the name of the field and then click on the single right pointing arrow. We then repeat this action for the other two fields. When we are finished our dialogue box will look as in Fig‑3.
Fig 3
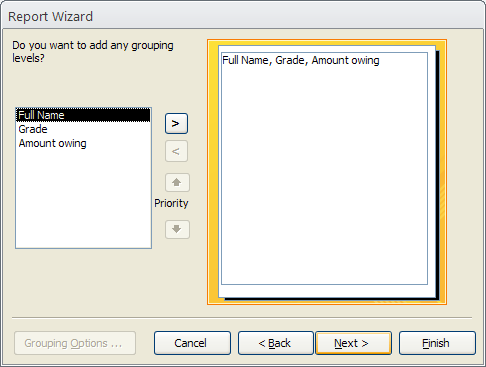
Clicking on the Next button will bring us to the second stage of the wizard in Fig‑4.
Fig 4
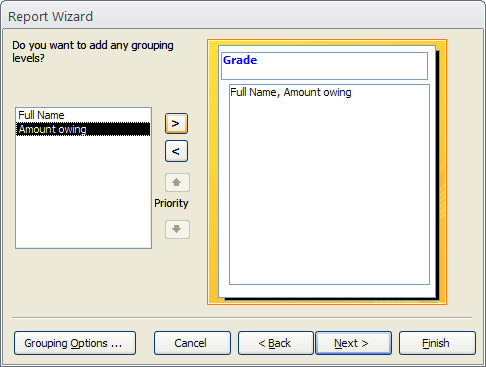
This stage allows us to specify the grouping for the report. In the box on the left are all of the fields in the report. We have to select one of those and then click on the button with the arrowhead on it. In our case, since we want to group our report on Grade we select that field and bring it across. The preview of the report on the right side of the dialogue box now alters to that in Fig‑5.
Fig 5
This clearly shows us that Grade will be the group header and that Full Name and Amt Owing will be the details for that group. WE now click on Next to bring us to the third stage of the wizard.
Fig 6
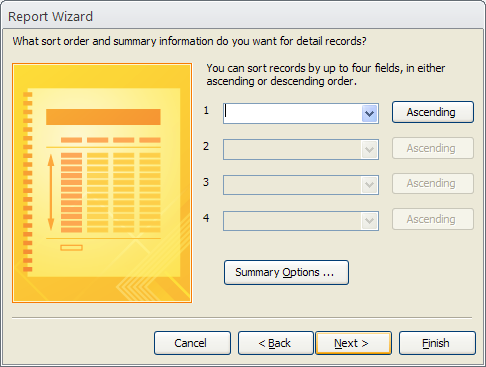
This stage allows us to sort the detail records on whichever field we want. We are not interested in sorting data in our case but we are interested in the summary that will go into the group footer. For this reason we click on Summary Options – which brings up the dialogue box in Fig‑7.
Fig 7
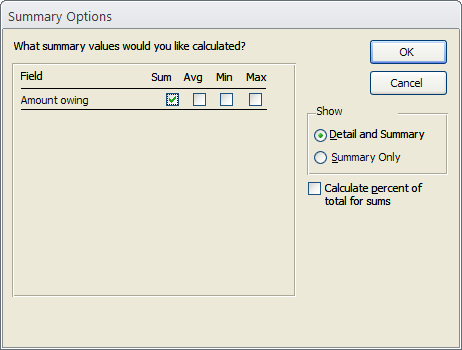
The only field in our query which is numeric is Amt Owing and this is, therefore, the only field we are allowed to summarise. Of the summary options we choose Sum and click on OK. This returns us to Fig‑6 and here we click on Next to go to the fourth stage of the wizard.
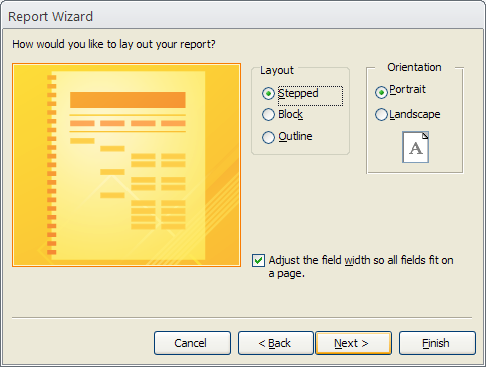
This stage allows us to select the layout of the report. It does not make much difference which layout we select. For the example in this book Align Left 2 was selected. In our case we are displaying only three fields and thus Portrait orientation is sufficient. For a larger number of fields Landscape may be better.
Fig 8
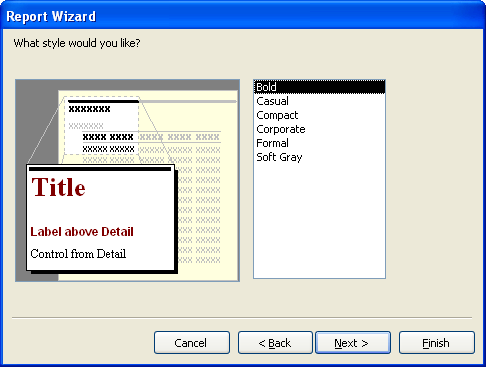
The second last stage of the wizard is the style option. Again it does not really matter which style we pick but once we have done it we go on to the final stage of the wizard in Fig‑10
Fig 9Fig 10
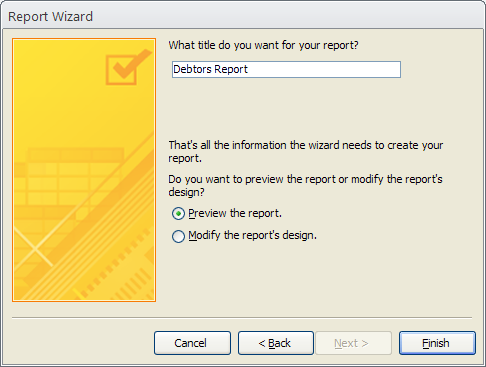
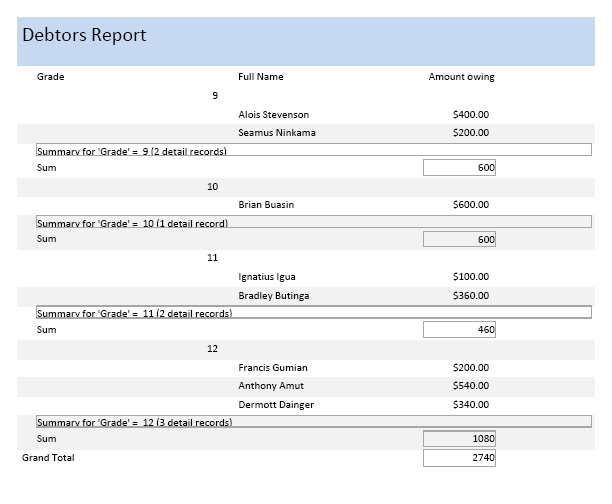
In the text box labeled What title do you want for your report? we enter Debtor’s Report. This is the text that will appear at the top of the report. Clicking on Finish will bring up a print preview of the report as shown below.
Fig 11
As indicated above, this report, although easy to produce, is not ideal. Our main problems are:
In the header for Grade the text “Grade” and the number for that grade are separated by too much space. It would look much better if it was in the form “Grade 10”.
The same header contains the captions for the fields Full Name and Amt Owing.
There is far too much detail in the footer for Grade. A better footer would contain a single line with something like “Subtotal for Grade 10” followed by the actual subtotal.
In order to remedy those minor problems we need to be able to create a report manually.
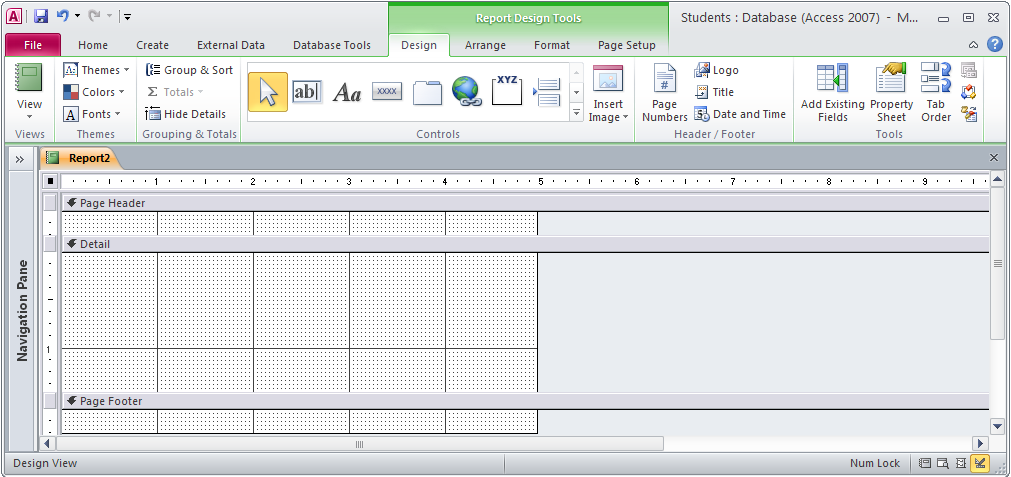
To create a report manually we select the Create tab and in the Reports group select Report Design. This gives us a design view as shown in Fig‑12. It bears a remarkable resemblance to a form’s Design View and we will in fact be putting labels and text boxes in it in a similar way to how we put those controls onto a form. Also, like a form, the report must have an underlying table or query attached to it. This has not yet been done, however.
Fig 12
Our next task is to add a header and footer to the form. We need those because:
The main title of the report must go into the report header
The grand total for all fees owed must go into the report footer.
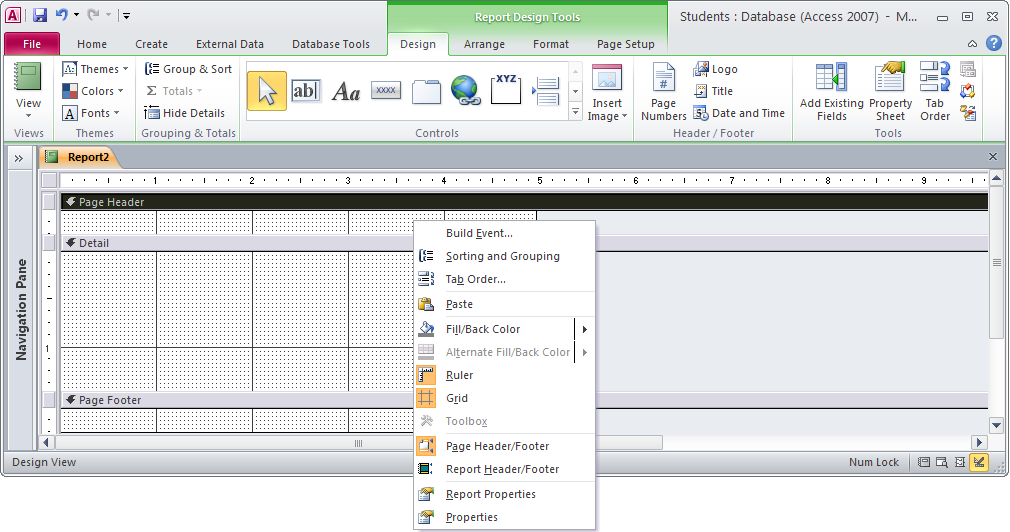
In order to add a header and footer we right click on the form which gives us a display as in Fig‑13.
Fig 13
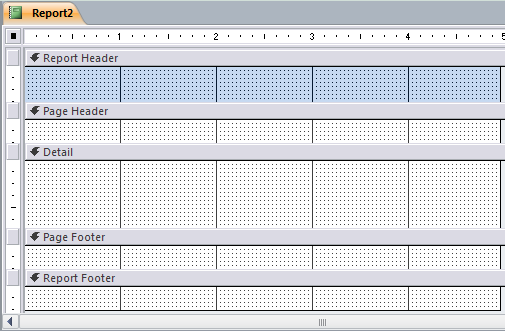
From the pop up menu we select Report Header/Footer. As soon as we do, the display will change to that shown in Fig‑14.
Fig 14
As stated earlier we shall put the main report title into the Report Header area and the grand total for all fees owed into the Report Footer area. We shall put the column headings into the Page Header area and the page number into the Page Footer area.
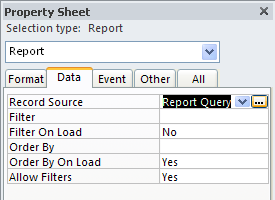
We have one more header/footer grouping to add but before we can do that we must connect our report to a query. To do this we right click on the form area as we did above in Fig‑13. This time, however we click on the option Properties. This brings up the properties box shown in Fig‑15.
Fig 15
Here we select the Data tab and click on the down arrow beside Record Source. This will cause a drop down list to appear which includes the names of the tables and queries in the database. From this list we select Report Query. This makes no alteration to our display, but as we are connected to the query we shall now be able to create an extra grouping, based on one of the fields of that query – in this case the Grade field.
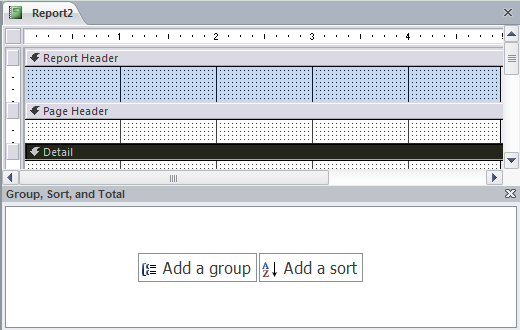
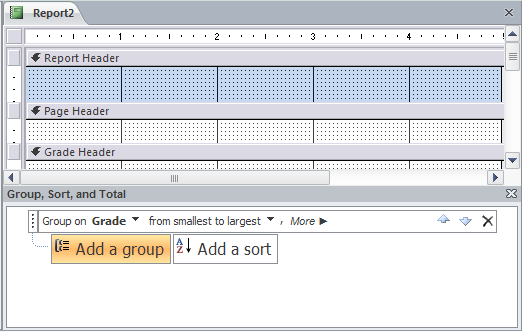
To add this grouping we right click on the form, once again bringing up the pop up menu of Fig‑13. This time we select Sorting and Grouping. Our display will now alter to that shown in Fig‑16. A new panel titled Group, sort and Total, has been added to our report.
Fig 16
In this panel we click on Add a group. This alters the panel to that shown below.
Fig 17
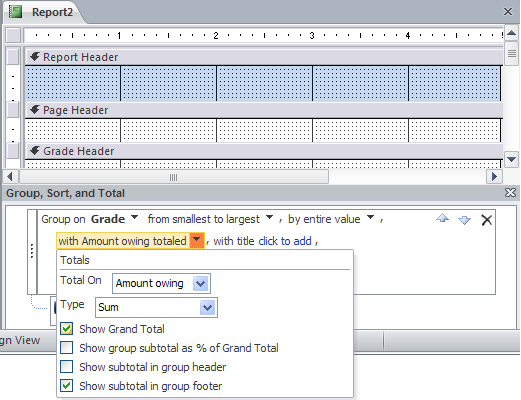
In the Group on option we click on the down arrow and from the drop down list, which shows us the fields in the query we select Grade. This automatically creates a group header for Grade as shown above. It does not, however create a footer. In order to create the footer we click on More in the panel shown in Fig‑17. This will cause our Group, Sort and Total panel to change to that shown below.
Fig 18
Access presumes that since we wish to add a footer to the group we want to add subtotals for the same group. In this case they are correct. Here we first of all click on the down arrow of the combo box labeled Total on and select the field Amount owing. Next we check the boxes Show Grand Total and Show subtotal in group footer. Once we do this our display changes to that shown in Fig‑19
Fig 19
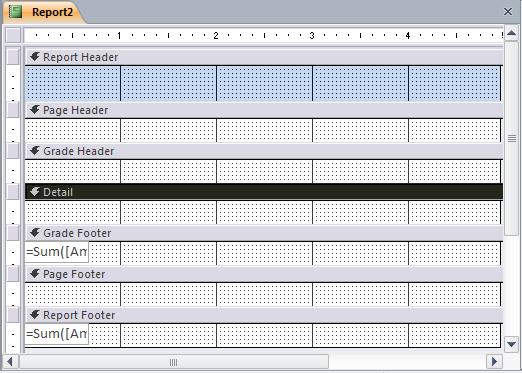
Let us spend some time examining the hierarchy of nestings in this layout before proceeding further:
At the very top we have the report header and at the very bottom we have the report footer. The report header is equivalent to a chapter header. Here we put the title of the report and the company logo if we are using one. We may also put the name of the person who compiled the report. In the report footer we put the grand total of any fields whose values we are summing.
Inside the report itself we have the page header and footer. Notice that the page header is below the report header and that the page footer is above the report footer. In the page header we put the field headers for the report while the footer is reserved for the page number. Thus, if the report runs to more than one page, each page will have the field headers on it at the top and the page number at the bottom of the page.
Inside the page we have our own first grouping – the grade grouping – again with a header and footer. In the grade header we shall put the number of the grade along with an explanation of what it is. In the footer we shall put the total for the amount owed for each grade.
Now proceeding from top to bottom let us enter the appropriate controls into the different parts of the report.
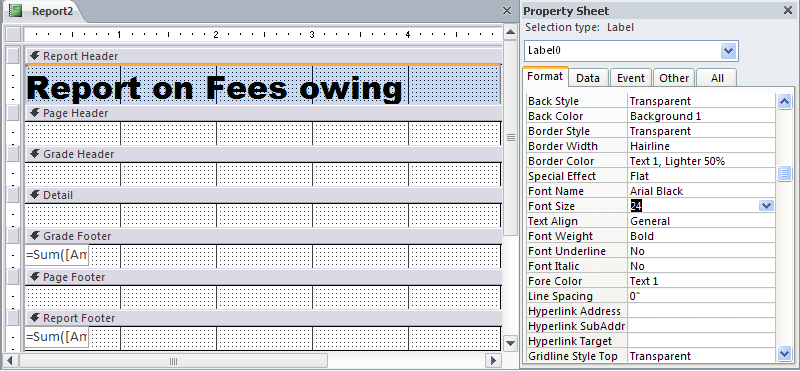
In the report header we enter a label to which we add the caption “Report on Fees owing”. Since it is the report header we shall alter its appearance. To do this we bring up the Property Sheet for the form as shown below in Fig‑20
Fig 20
Here we have altered Font Name to Arial Black, Font Size to 24 and Font Weight to Bold.
We now go to the page header where we shall put two labels that will act as headers for the fields Student Name and Amount Owing. To do this we simply enter two more labels here and change their captions to “Student Name” and “Amount Owing”.
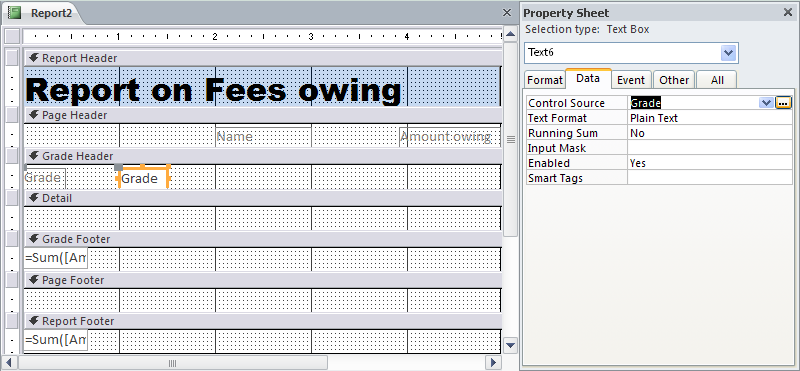
Our next area is the grade header. Here we shall enter a text box. In Access when we enter a text box into a form or a report a label is automatically added to the textbox. In the label we enter the word ‘Grade’, while we connect the textbox itself to the Grade field of the query. To do this we ensure that the Property Sheet is visible. If we now select our new textbox the properties of that textbox will appear in the Properties sheet.
Fig 21
The property we are interested in is Control Source. This has a down arrow beside it. Clicking on this down arrow will reveal the fields of the query to which the report is connected. From this list we select Grade.
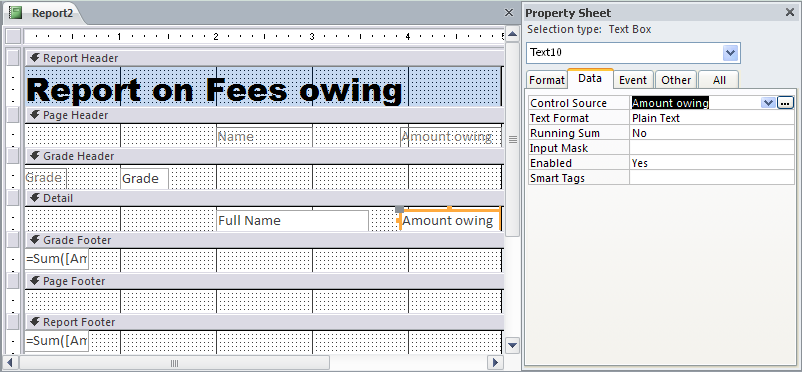
In the Detail area we enter two text boxes and we connect them to the fields Full Name and Amount Owing respectively. To do this we go the Property Sheet of each textbox and alter the Control Source property to the name of the appropriate field.
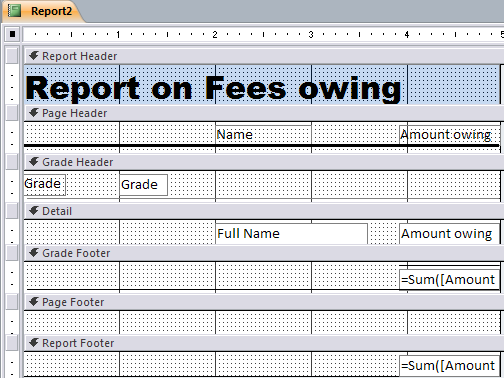
The subtotals for the group and report footers have already been set for us and thus we only need to save the report. At this stage it looks as in Fig‑22
Fig 22
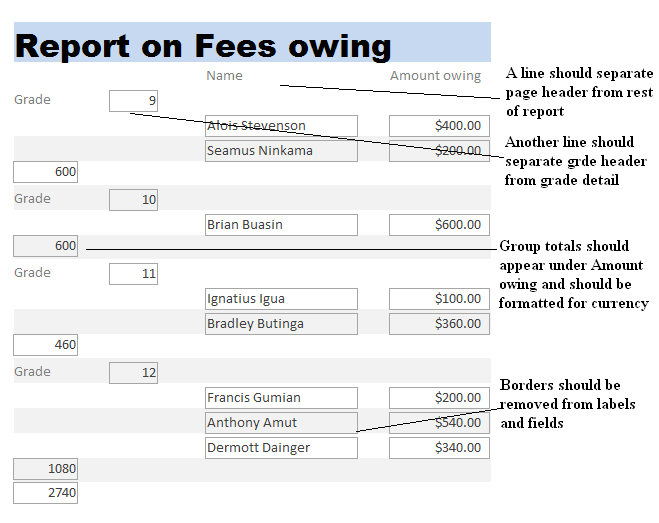
If we now right click on the tab containing the report name and select Print Preview we get the actual report as shown below.
Fig 23
Although the above report corrects the weaknesses we found in the report created by the wizard as well as correctly separating the grades, subtotals for each grade and also subtotals for the entire report, it leaves a lot to be desired as far as presentation is concerned. Most of the shortcomings are listed on the report itself as comments. We shall look at how to remedy each one of those.
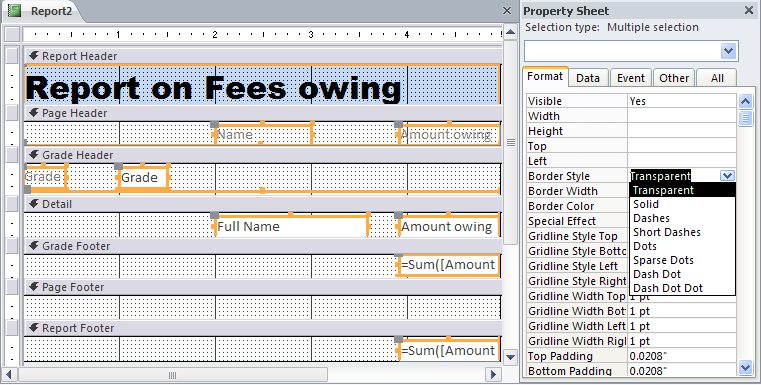
The easiest one to start with is the positioning of the subtotals. We simply drag the textboxes over to the right hand side of the report and position their left margins directly underneath the Amount owing field. The next easiest is removing the borders from the text boxes. This is shown in Fig‑24 below.
Fig 24
Here we select all of the text boxes and labels on the form. Next on the property Sheet we select the Border Style property and change its value to Transparent. Although the borders still remain in Design View, once we go to Print Preview the borders will disappear.
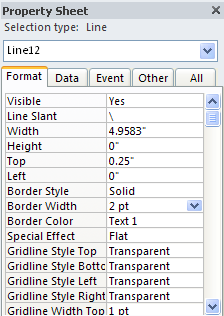
Finally we enter lines to separate different parts of the report. Starting from the top we insert a line at the bottom of the Page Header section. The line by default is a thin line. As it is separating the page headers from the rest of the data it should be thicker than the rest of the lines. To thicken the line we select it and then ensure that the Properties Sheet is visible.
Fig 25
The only properties we need to change are Border Style and Border Width. The former should be set to Solid and the latter should be set to 2 pt.
Another line should be inserted at the bottom of the Grade Footer section. This should go the full width of the report. It should be left its default hairline width. Also a short line should be drawn above the subtotal text boxes in the Grade footer. This line should not extend beyond the width of the boxes themselves. The report design should now look as in Fig‑26
Reports are generally based on queries although they can also be based on tables. They can be created manually or by using a wizard. In practice the initial report is created using a wizard and then the result is tweaked to our specifications or in other words we remove the extra bits that we don’t want and we add features that we want ourselves. Reports are generally grouped on at least one field from the underlying query. This means that all records where the value in this field are the same are grouped together in the report. This grouping can have its own header and footer. In our case the report is grouped on the field Grade. This means that all of the grade 10 records are grouped together. In this grouping we have a header which simply shows the word “Grade” as well as the number of the grade. In the footer we have a subtotal of all the money owed by the grade 10 students. All other grades are treated in a similar manner.
Create a report based on the last query created in Exercise 4. The report is to be grouped on the field Publisher. The group is to have both a header and footer. The header will only have the name of the publisher displayed. The footer will have a subtotal for the publisher which will be formatted as follows “Subtotal for Penguin: $1200” – in other words the text “Subtotal for “ added to the publisher name and added to the subtotal for that publisher.
The report may be created manually or the initial part of it may be created using the Wizard and the rest can then be modified manually.