Learning Outcomes
On completion of this page you will know:
- the need for a caption on a table
- the need for both column and row headings
- how to mark up a table with column headings only
- how to mark up a table with both column and row headings
On completion of this page you will know:
If you are creating tables in either Microsoft Word or Excel then you have great scope for being creative. You can merge a group of cells across a row into a single cell. You can also merge then down a column. You can even merge a two dimensional group of cells into a single cell as shown in Fig 1 below.
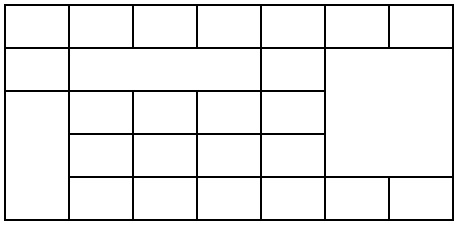
You can also build a table with merged cells like Fig 1 with HTML. But you shouldn't!
There is a very good reason for not having merged cells in your table: accessibility!. If you were asked to insert the value 45 into the cell at column 1, row 4 in Fig 1 above, where would you put it? The request is in fact meaningless because of the fact that since some of the cells have been merged column and row numbers have become meaningless. And if it is meaningless to us humans, then it is equally meaningless to a screen reader.
As we are designing web pages with screen readers in mind we have to insist on each row in a table having the same number of cells. An example of this is shown in Fig 2 below.
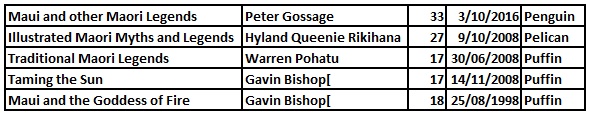
We can identify each value in this table since there is no confusion about which row or column any data item is. For example the value in row 3, column 2 is 'Warren Pohatu'.
Although we can identify each individual value in this table by using the column/row combination, we still have a problem with what the contents of the cells represent.
We can guess that the contents of the first column have something to do with story telling, but what format do they take? Are they books, films, downloadable videos, paintings or student assignments?
Equally confusing are the contents of column 2. Are they the names of book authors, directors/producers/actor in leading role, artists or teachers?
Data in this format is of no use to us on its own. We need extra information to allow us to interpret it. This information comes in the form of headers.
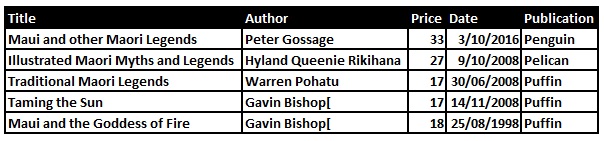
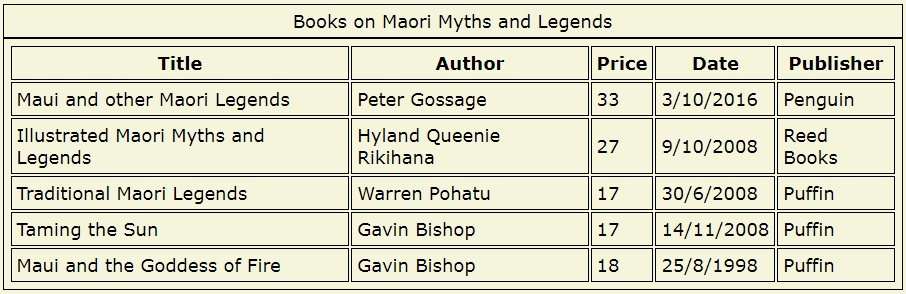
From the information in the column headers we can now determine that we have a table of books here, along with the author's name, price, date of publication and name of publisher. For a sighted user this is sufficient to allow them interpret the table's contents.
A blind user using a screen reader would not be so successful. The reason is that the screen reader is not able to distinguish between headings and actual data. It would, therefore, read out the headings first followed by the data without distinguishing between them. It would be very difficult for a user of a screen reader to match up the headings and the data.
As is apparent from both the video and the audio, the screen reader calls out the headings as if they were part of the data. Also the blind user has no means of referring back to them.
Go to topHere we shall look at marking up a table with headings. We shall mark up the headings in such a way that a screen reader can recognise them as such and will use them to clarify the table contents for the user.
                            <table>
                                <caption>Books on Maori Myths and Legends</caption>
                                <tr><th scope="col">Title</th><th scope="col">Author</th><th scope="col">Price</th><th scope="col">Date</th><th scope="col">Publisher</th></tr>
                                <tr><td>Maui and other Maori Legends</td><td>Peter Gossage</td><td>33</td><td>3/10/2016</td><td>Penguin</td></tr>
                                <tr><td>Illustrated Maori Myths and Legends</td><td>Hyland Queenie Rikihana</td><td>27</td><td>9/10/2008</td><td>Reed Books</td></tr>
                                <tr><td>Traditional Maori Legends</td><td>Warren Pohatu</td><td>17</td><td>30/6/2008</td><td>Puffin</td></tr>
                                <tr><td>Taming the Sun</td><td>Gavin Bishop</td><td>17</td><td>14/11/2008</td><td>Puffin</td></tr>
                                <tr><td>Maui and the Goddess of Fire</td><td>Gavin Bishop</td><td>18</td><td>25/8/1998</td><td>Puffin</td></tr>
                            </table>
Fig 1 above shows the code for creating the table.
Line 2 begins by creating the table's caption. The caption text is "Books on Maori Myths and Legends". One may think that this is an overkill since the column headers we discussed earlier clearly indicate the purpose of the table. This is not the case. We are trying here to create a good experience for a blind user. By having a caption on the table the user finds out quickly what the contents of the table are. If they are not interested then the user has the option of skipping to the next item of the page instead of listening to a block of data that is of no use to them.
                                <th scope="col">Title</th>
                                <th scope="col">Author</th>
                                <th scope="col">Price</th>
                                <th scope="col">Date</th>
                                <th scope="col">Publisher</th>

                        </tr>
Line 3 in Listing 1 is where we mark up the headers for our columns. It consists of a <tr></tr> element. The <tr> stands for 'table row'. Inside it are nested five <th></th> elements. This makes the line too long and dense for it's structure to be easily apparent. For this reason a reformatted version of the line is shown in Listing 1.1. Here each of its five <th></th> elements are shown in separate lines. Hopefully this will make its structure more easily apparent.
The first <th></th> element is <th scope="col">Title</th>. The text between the opening and closing tags is the actual text that will appear in the header.
The <th> opening tag has an attribute scope. This attribute can have one of two values: 'col' or 'row'. In this case it is 'col'. This signifies that this header will relate to all of the cells below it in the same column. In other words those cells will contain book titles only.
Before we move on, please be aware that the headings that we have marked up here are not part of the table's data. They are simply headers or markers. They describe the data in the columns beneath them. They do this visually for the sighted users and they are called out to visually impaired users by the screen reader.
                        <tr>
                                <td>Maui and other Maori Legends</td>
                                <td>Peter Gossage</td>
                                <td>33</td>
                                <td>3/10/2016</td>
                                <td>Penguin</td>
                        </tr>
Above we have reformatted line 4 so that its <td></td> tags are clearly identifiable. Its structure is identical to that of line 3 but it uses the <td> elements, thus indicating that the text contained between the tags is actual table data.
Lines 5, 6, 7 and 8 are structured in the same way and therefore there is no need to go into details about them.
The table we have just examined is rendered below.
The video below shows a screen reader navigating through a table with proper headings marked up.
This properly marked up table is easier for a blind user to interpret because:
Again using an audio only version, we may get a better impression of how a blind user experiences navigating the table.
Go to top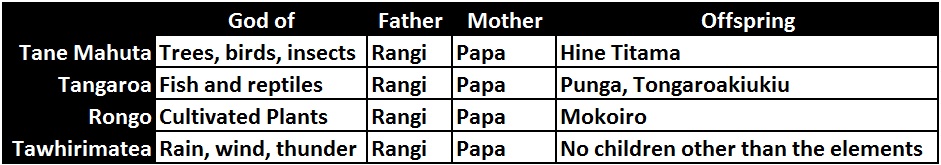
Above we see a more complex table; it has both column headings and row headings. It lists a few of the major Maori gods, what the function of each god was in the natural environment, who their immediate ancestors were and who their immediate progeny were.
Here we shall look at how to mark up such a table and then look at how the screen reader uses the markup to call out each data item preceded by both the column heading and the row heading, thus allowing a blind user to have a better experience.
                            <table>
                                <caption>Maori Gods, their patronage, ancestry and offspring</caption>
                                <tr><td></td><th scope="col">God of</th><th scope="col">Father</th><th scope="col">Mother</th><th scope="col">Offspring</th> </tr>
                                <tr><th scope="row">Tane Mahuta</th><td>Trees, birds, insects</td><td>Rangi</td><td>Papa</td><td>Hine Titama</td></tr>
                                <tr><th scope="row">Tangaroa</th><td>Fish and reptiles</td><td>Rangi</td><td>Papa</td><td>Punga, Tongaroakiukiu</td></tr>
                                <tr><th scope="row">Rongo</th><td>Cultivated Plants</td><td>Rangi</td><td>Papa</td><td>Mokoiro</td></tr>
                                <tr><th scope="row">Tawhirimatea</th><td>Rain, wind, thunder</td><td>Rangi</td><td>Papa</td><td>No children other than the elements</td></tr>
                            </table>
For Listing 1 only line 3 needed to be explained. For listing 2 above both lines 3 and 4 need to be explained. This is because we are dealing with row headings as well as column headings.
                            <tr>
                                    <td></td>
                                    <th scope="col">God of</th>
                                    <th scope="col">Father</th>
                                    <th scope="col">Mother</th>
                                    <th scope="col">Offspring</th>
                            </tr>
Within the <tr></tr> block the first item is a blank <td><td>. The reason for this is that in a table with both row and column headings the top left hand corner is usually blank. This can be seen in the top left corner of Fig 5
The other four items are column headings that we have already covered in the previous table.
                        <tr>
                                <th scope="row">Tane Mahuta</th>
                                <td>Trees, birds, insects</tr>
                                <td>Rangi</td>
                                <td>Papa</td>
                                <td>Hine Titama</td>
                        </tr>
Row 4 is the first row in our table that contains data. Unlike the data rows in the previous table the first item in the <tr></tr> block is another header block. This is because each row starts with its own header. Also notice that the header has a scope of "row". This information is used by the screen readers to match the column headings with the row headings
Other than the first item in the row the rest are <td></td> blocks where actual data is stored.
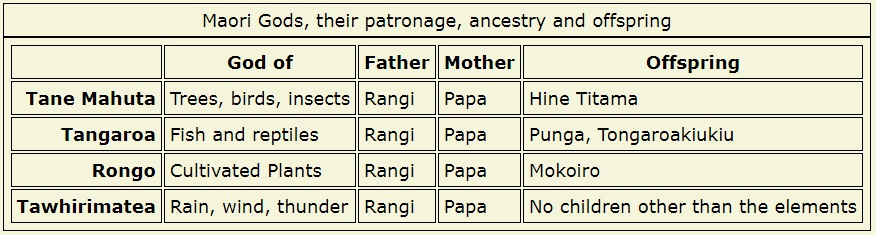
The completed table would look similar to Fig 6 above.
In the above video only the orange markers would be produced by the screen reader itself. The dark blue markers were deliberately inserted when the video was being designed to convey the idea that each cell has both a colum header and a row header.
They we styled the tables so that screen readers could interpret the information in column and row headers complies with this criterion. Find out more from the article Using table markup to present tabular information
Go to topWe have looked at the necessity of having properly structured tables with an equal number of cells in each row. This in order that we could refer to every cell in the table by its column and row number
Because we are aiming our table at people who need to use screen readers as well as sighted people we need a caption on our table so that people who use screen readers can skip out of the table if the content does not interest them.
Column and row headings are also needed so that all users can identify the content of each individual cell in the table.
Go to topFor this assignment, you will demonstrate your comprehension of the principles discussed regarding designing accessible tables for visually impaired users. Your task is to provide a written narrative that showcases your understanding of the need for proper table markup, headers, captions, and compliance with WCAG success criteria. Use examples and explanations based on the material provided.
In your response, you should address the following key areas:
1. The Importance of Consistent Structure: Explain why tables must maintain an equal number of cells in each row, avoiding merged cells. Discuss the challenges that inconsistent structures pose for screen reader users and how consistency aids navigation.
2. The Role of Headers: Describe the function of column and row headers in accessible tables. Highlight how the use of the `
3. Captions in Tables: Elaborate on the significance of the `
4. Compliance with Accessibility Standards: Discuss how the techniques presented align with WCAG success criteria, specifically the criterion 1.3.1 (Info and Relationships). Provide insights into how these practices promote inclusivity.
5. Practical Application: Imagine you are advising a colleague who is creating an HTML table. Write a brief set of recommendations that encapsulate the best practices for creating accessible tables, including a rationale for each point.
Ensure your narrative flows naturally, integrating technical details, examples, and explanations seamlessly. While you do not need to create an actual HTML table, your narrative should clearly reflect your grasp of the concepts and demonstrate how you would implement these principles in practice.
Go to top